Quant Analyzer Report
StrategyTester_Tiger for Abe deposit
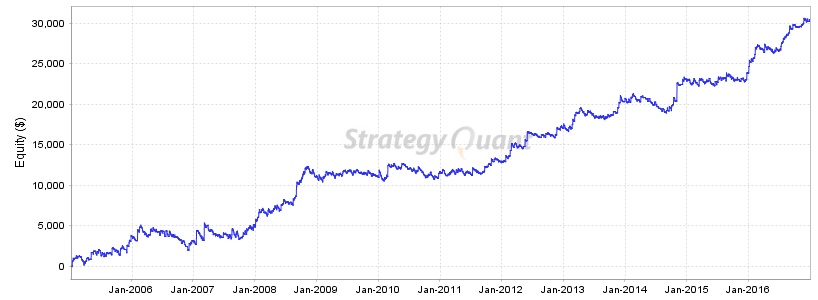
Source: MT4Report| Symbol | GBPJPY | Period | D1 : 03.01.2005 - 30.12.2016 |
|---|---|---|---|
| Initial deposit | 10000.0 | ||
| Parameters | - | ||
Total Profit
$ 30338.68
Profit in pips
35209.2 pips
Yrly Avg profit
$ 2527.89
Yrly Avg % ret
25.28 %
CAGR
12.33 %
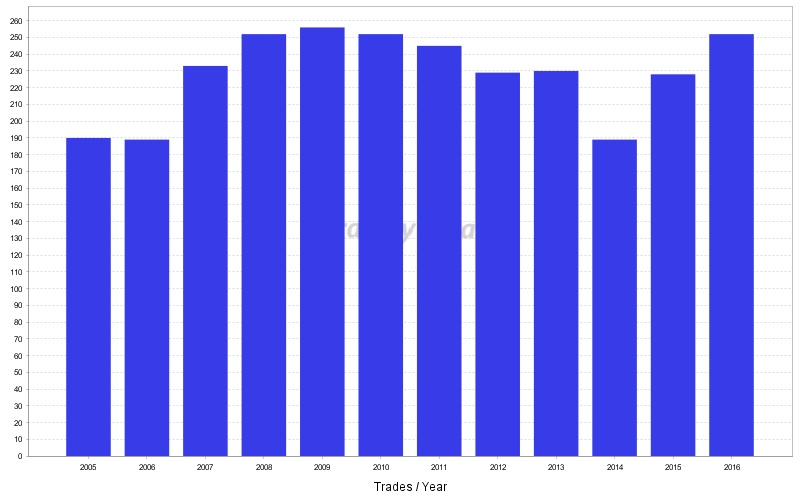
# of trades
2745
Sharpe ratio
0.07
Profit factor
1.26
Return / DD ratio
9.84
Winning %
53.89 %
Drawdown
$ 3082.15
% Drawdown
20.46 %
Daily Avg profit
$ 7.54
Mthly Avg profit
$ 210.69
Average trade
$ 95.76
Annual% / Max DD%
0.6
R Expectancy
0.11 R
R Exp score
24.2 R
SQN
4.47
SQN score
1.77
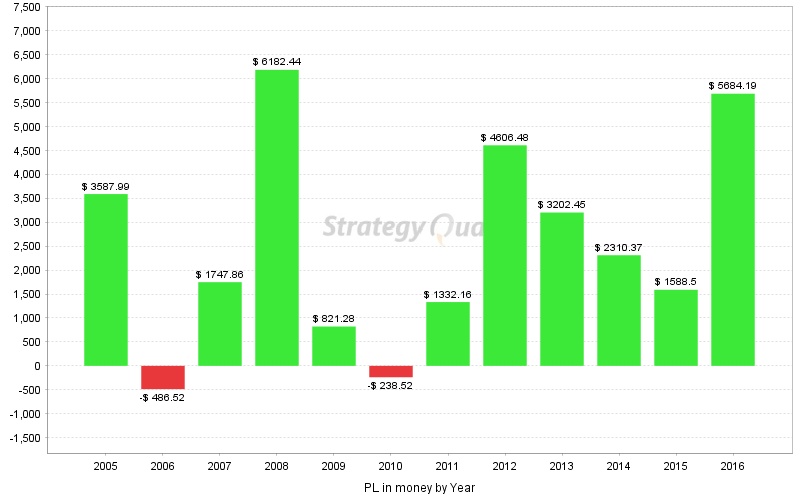
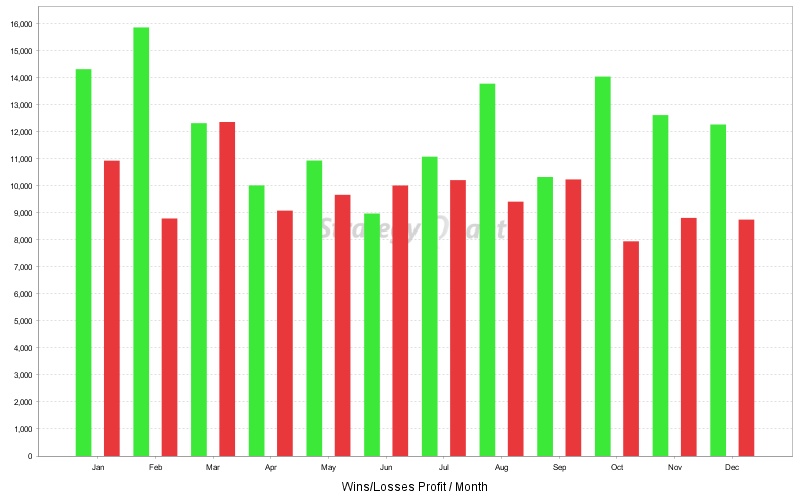
Monthly Performance ($)
| Year | Jan | Feb | Mar | Apr | May | Jun | Jul | Aug | Sep | Oct | Nov | Dec | YTD |
| 2016 | 1023.02 | 1548.55 | -737.27 | 515.14 | -523.38 | 77.48 | 1492.3 | 1442.75 | 304.5 | -197.05 | 733.27 | 4.88 | 5684.19 |
| 2015 | -452.11 | -65.35 | 397.99 | -43.65 | -283.32 | 77.19 | 565.55 | 436.17 | -463.8 | -187.82 | -82.73 | 1690.38 | 1588.5 |
| 2014 | -108.69 | 256.72 | 19.27 | -352.98 | -321.38 | -221.6 | -548.66 | -276.07 | 613.63 | 2763.91 | 412.18 | 74.04 | 2310.37 |
| 2013 | -500.38 | 926.53 | 1291.2 | -242.71 | 37.04 | -617.81 | 65.63 | -229.17 | 267.54 | 390.63 | 2124.71 | -310.76 | 3202.45 |
| 2012 | 480.43 | 1690.8 | -351.65 | -170.26 | 1911.19 | -134.11 | -349.7 | 88.59 | 326.25 | -410.22 | 869.02 | 656.14 | 4606.48 |
| 2011 | -268.84 | 122.96 | 95.16 | 79.17 | -97.76 | -202.55 | 581.01 | -487.83 | 828.66 | 994.39 | -72 | -240.21 | 1332.16 |
| 2010 | -1255.35 | 1826.06 | 217.63 | -484.39 | 432.7 | -520.6 | -136.74 | 176.5 | -885.9 | 96.87 | -144.1 | 438.8 | -238.52 |
| 2009 | -408.37 | 982.5 | -281.62 | -17.25 | -134.9 | 549.28 | -447.56 | 548.71 | -489.28 | 431.1 | -366.73 | 455.4 | 821.28 |
| 2008 | 1771.43 | -39.95 | -19.22 | 604.53 | 373.74 | 319.43 | -18.11 | 1859.16 | 869.71 | 1570.55 | -583.01 | -525.82 | 6182.44 |
| 2007 | 1030.54 | -186.95 | 384.15 | -312.21 | -226.38 | 141.52 | -191.95 | 138.84 | -442.91 | 791.67 | 732.64 | -111.1 | 1747.86 |
| 2006 | 898.2 | 186.13 | -933.38 | 570.9 | 53.41 | -73.99 | -498.21 | 107.29 | -513.01 | -592.51 | -20.71 | 329.36 | -486.52 |
| 2005 | 1177.31 | -174.01 | -125.77 | 787.72 | 48.25 | -432.77 | 355.06 | 563.72 | -325.45 | 449.01 | 204.32 | 1060.6 | 3587.99 |
Stats
Strategy
| Wins/Losses Ratio | 1.17 | Payout Ratio (Avg Win/Loss) | 1.08 | Average # of Bars in Trade | 0 |
| AHPR | 0.05 | Z-Score | -7.31 | Z-Probability | 0 % |
| Expectancy | 11.05 | Deviation | $ 154.7 | Exposure | -999999999 % |
| Stagnation in Days | 574 | Stagnation in % | 13.11 % |
Trades
| # of Wins | 1301 | # of Losses | 1113 | # of Cancelled/Expired | 331 | ||
| Gross Profit | $ 146603.66 | Gross Loss | $ -116264.98 | Average Win | $ 112.69 | Average Loss | $ -104.46 |
| Largest Win | $ 816.17 | Largest Loss | $ -157.8 | Max Consec Wins | 9 | Max Consec Losses | 11 |
| Avg Consec Wins | 2.23 | Avg Consec Loss | 2.47 | Avg # of Bars in Wins | 0 | Avg # of Bars in Losses | 0 |
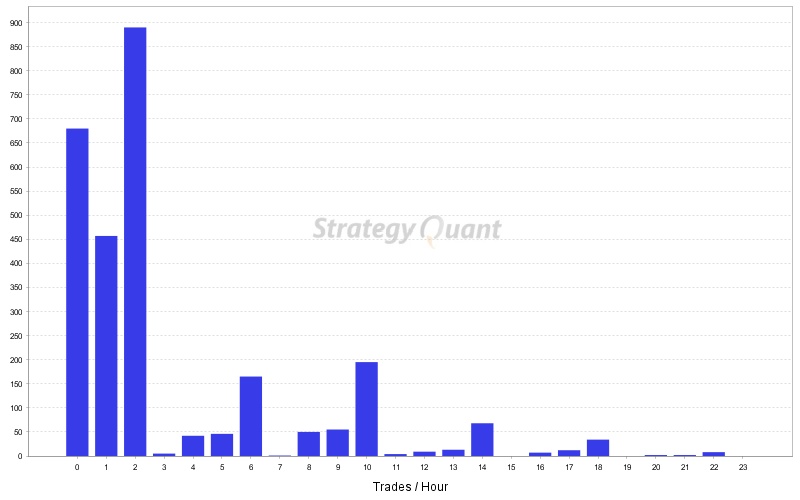
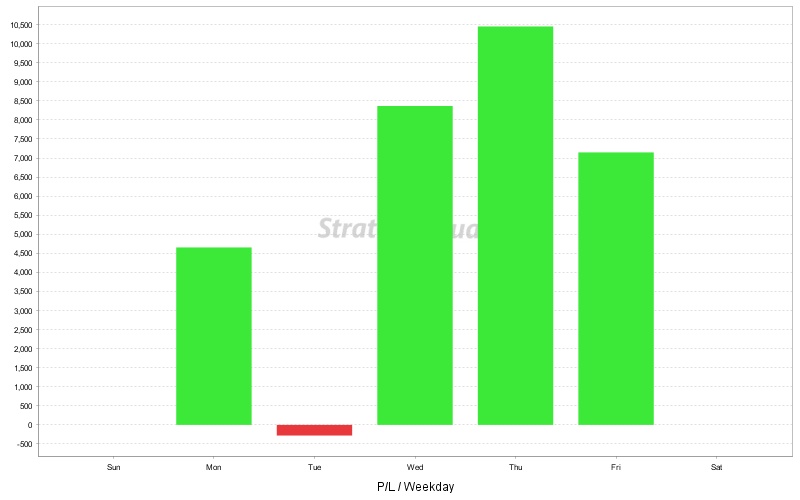
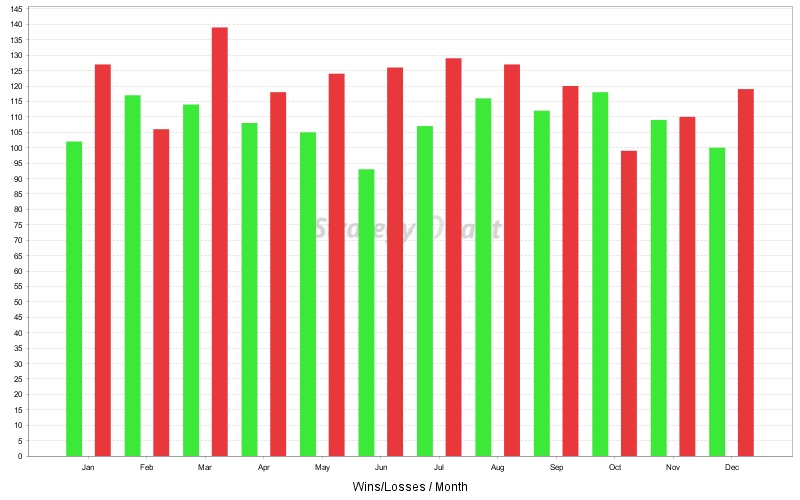
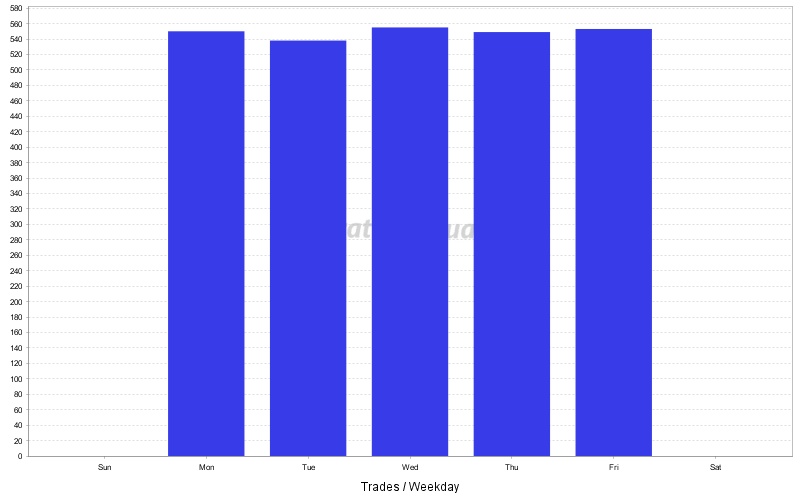
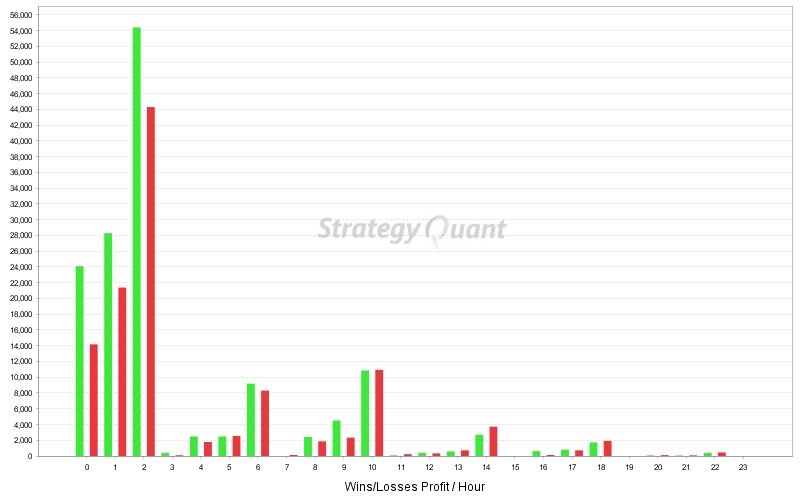
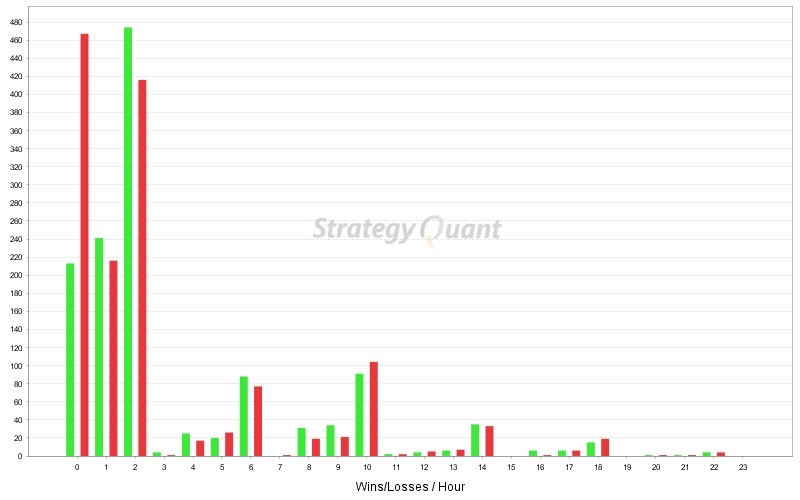
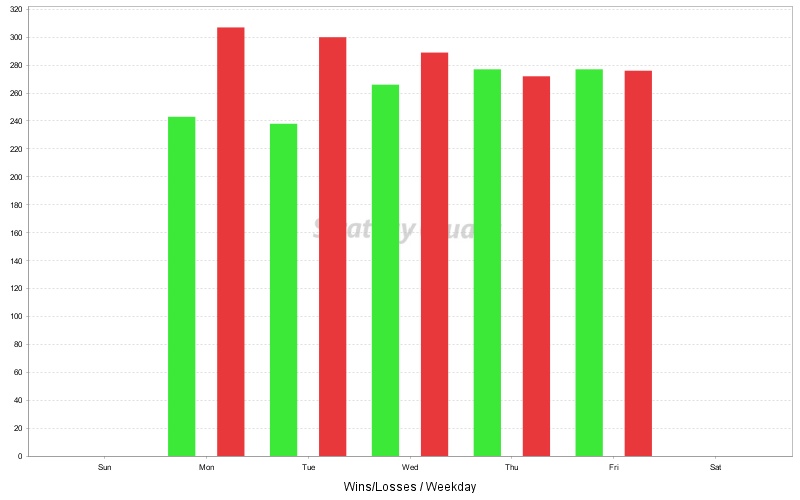
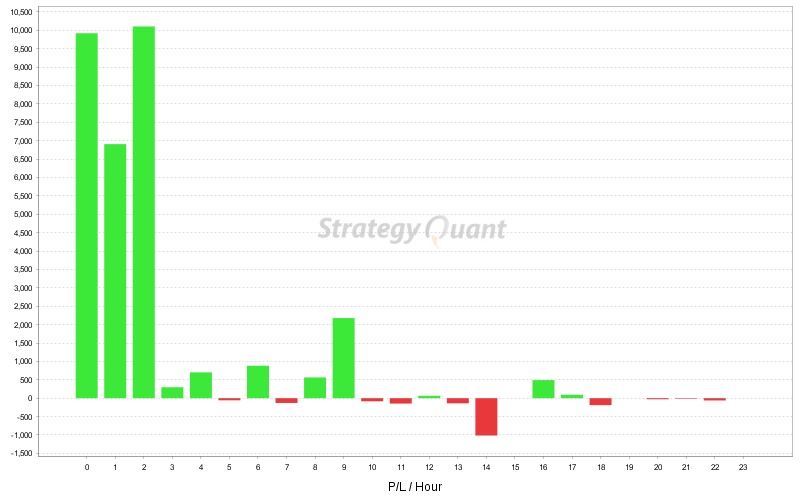
Charts
Click on the chart to see bigger image